
Dapr is an impressive set of APIs for building distributed applications with any language and platform. It provides a set of building blocks that you can use to build microservices. Dapr is based on sidecar architecture. Meaning that you need to run a Dapr sidecar for each of your applications. How do you debug your Dapr apps effectively? If you have been using PowerShell scripts to run and attach your debugger, you know how tedious and error-prone it can be. Ready to see how to use Rider or Visual Studio to debug your Dapr apps with ease and confidence?
Running Dapr application
To run the Dapr application, you need to use the Dapr CLI and define some parameters like the application name and port, the location of the definition of the Dapr components, and the command line to run your application. It looks something like this for a .NET application.
dapr run --app-id dapr-service --resources-path ../../dapr/components/ --app-port 5190 -- dotnet run --project .How can you debug your application? It is the Dapr sidecar that is starting your application. You want to attach the debugger to your application, not to the Dapr sidecar. You can use the IDE Attach to process feature. This is not convenient, but it works.
Debugging Dapr application a better way
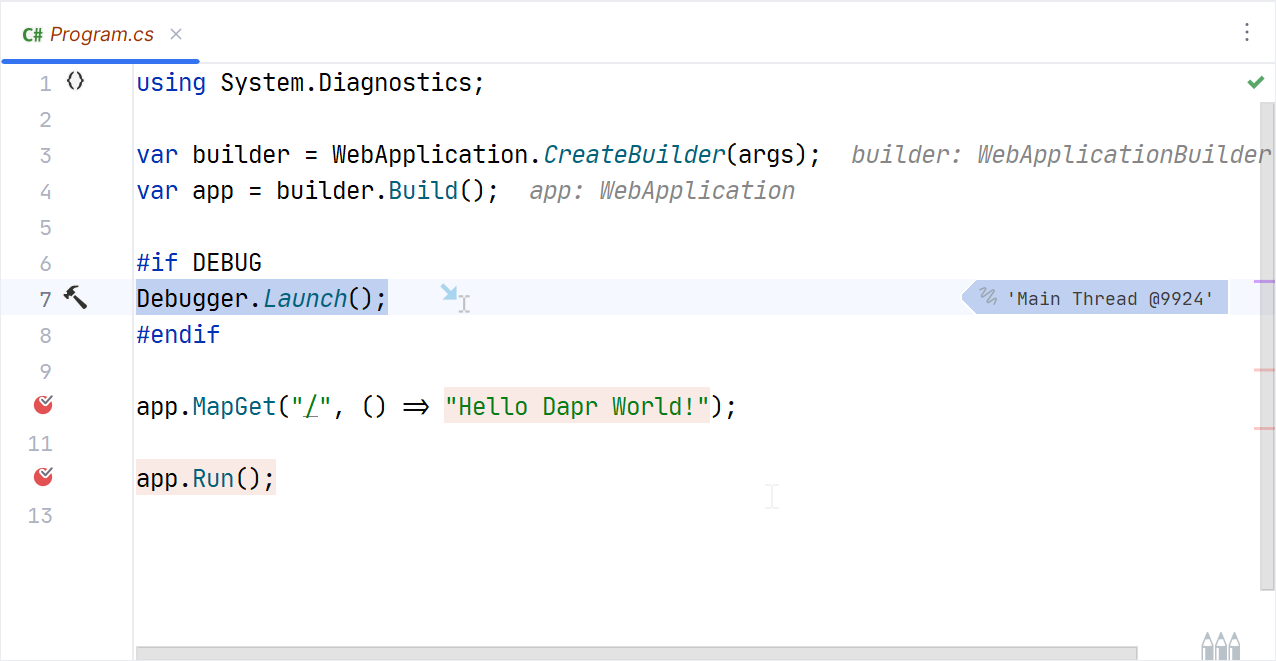
Another way is to leverage Debugger.Launch() and nest it in a #if DEBUG C# preprocessor directive. This way, the code is compiled only when you are in debug mode. Place those three lines in your application entry point. A good place is in the Program.cs file.
#if DEBUG
Debugger.Launch();
#endifDebugger.Launch(), as its name implies, will launch and attach a debugger to the process.
Solution for Rider and Visual Studio
In Rider and Visual Studio, you can leverage the launchSettings.json and add one entry to its profiles to run the Dapr CLI command and your application.
    "dapr": {
      "commandName": "Executable",
      "workingDirectory": "$(ProjectDir)",
      "executablePath": "dapr.exe",
      "commandLineArgs": "run --app-id dapr-service --resources-path ../dapr/components/ --app-port 5190 -- dotnet run --project ."
    }
It is nice to note that we can use MSBuild properties like $(ProjectDir) to define the project path as the working directory.
The good thing about that approach is that this can be shared in a team through the source control system. You can also use the launchSettings.json to run your application without Dapr with another profile.
    "http": {
      "commandName": "Project",
      "dotnetRunMessages": true,
      "launchBrowser": true,
      "applicationUrl": "http://localhost:5190",
      "environmentVariables": {
        "ASPNETCORE_ENVIRONMENT": "Development"
      }
    }
Now you can run your application with Dapr or without Dapr using the IDE Run/Debug configuration.
Debugging configuration for Rider
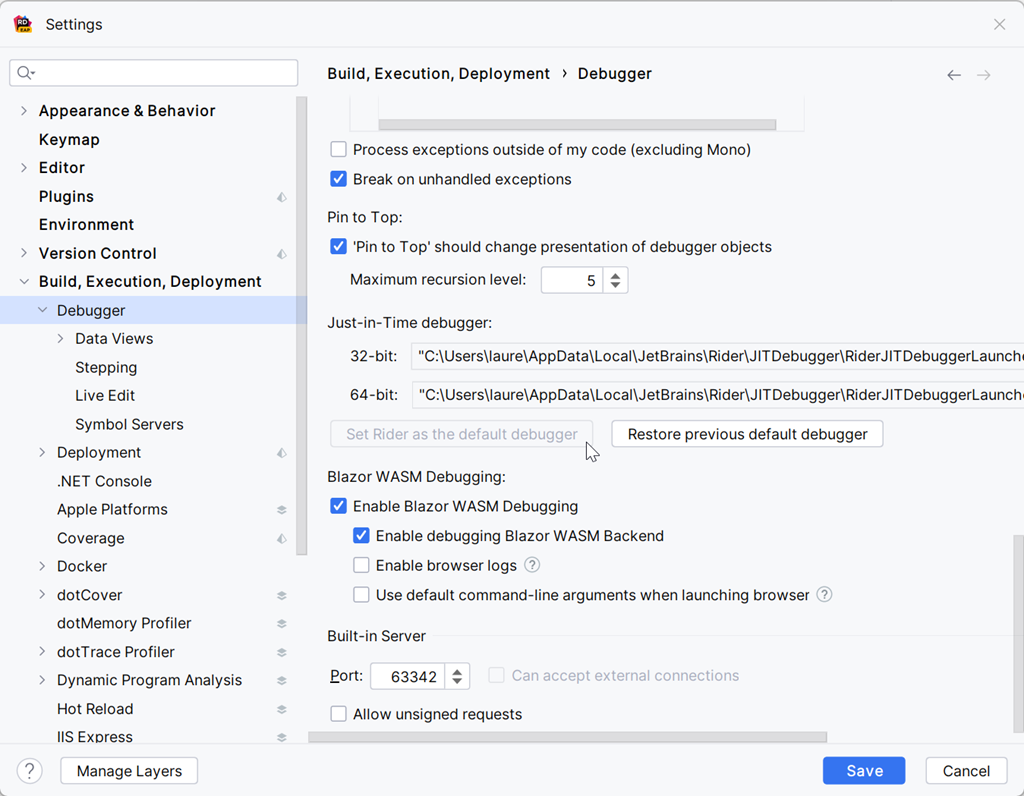
We need to set Rider as the default debugger. We can do that by going to Settings and then Build, Execution, Deployment and then Debugger. In the popping dialog, click the button Set Rider as the default debugger and follow the instructions.
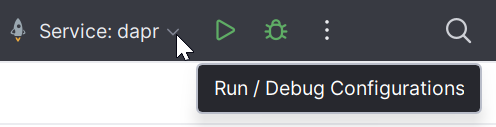
Now, we can select the Run/Debug configuration Service: dapr and either Run (CTRL+F5) or Debug (F5).
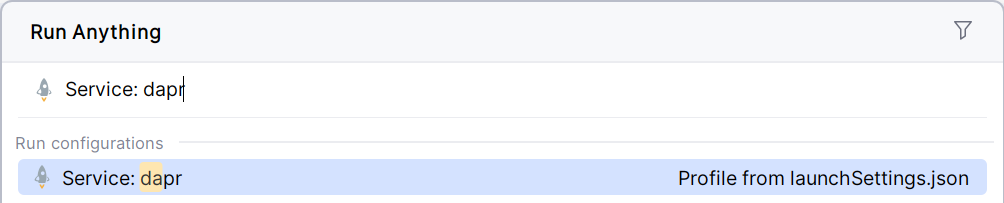
Or press the CTRL key two times to use Rider Run Anything. Then type dapr to select the Run/Debug configuration.
The Dapr sidecar starts, the sidecar starts your application, and the Rider Just-ln-Time Debugger dialog popups. Select your project and tick Remember executable in solution. This creates a new run configuration in the selected solution with the target executable. Next time, if a solution is open with such a run configuration, this solution will be chosen automatically. Meaning that from the second time you start with the Dapr profile, you won’t even see the Rider Just-ln-Time Debugger dialog.
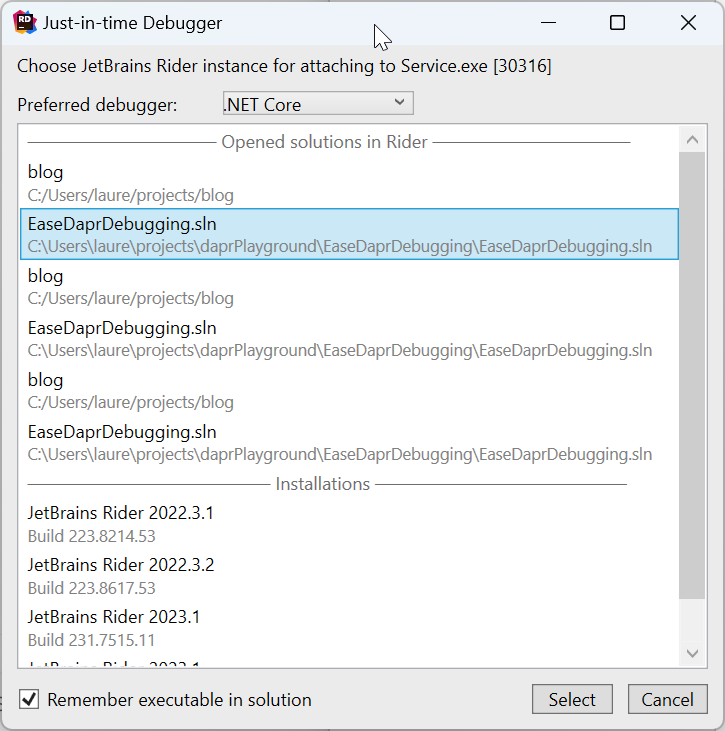
After that, click the Select Button, and the debugger will be attached to the process and will break on the line Debugger.Launch(), and you can happily debug your application 😃.
On the next debugging session, the Just-ln-Time Debugger dialog will not pop up anymore. You will be able to debug your application directly.
Dapr sidecar and application outputs are displayed in the Rider Debug Output window if started in Debug. Or, in the Rider Run Console if started without Debug. That is fantastic because you do not need to switch between windows to see the outputs.
Debugging configuration for Visual Studio
If you set Rider as the default debugger, you need to reset those settings from the Rider settings dialog.
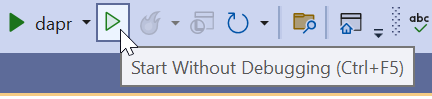
In Visual Studio, you can select the Launch profile dapr and must use Run (CTRL+F5).
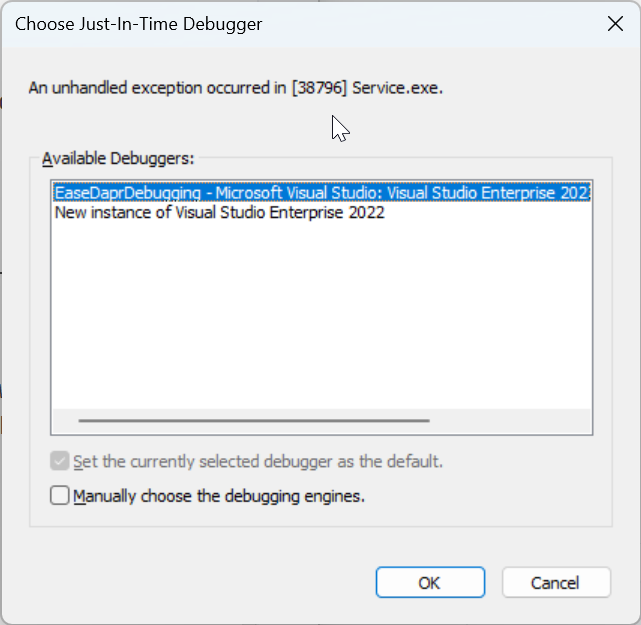
A command window will open, followed by the Visual Studio Choose Just-ln-Time Debugger dialog. Select your project from the Available Debuggers.
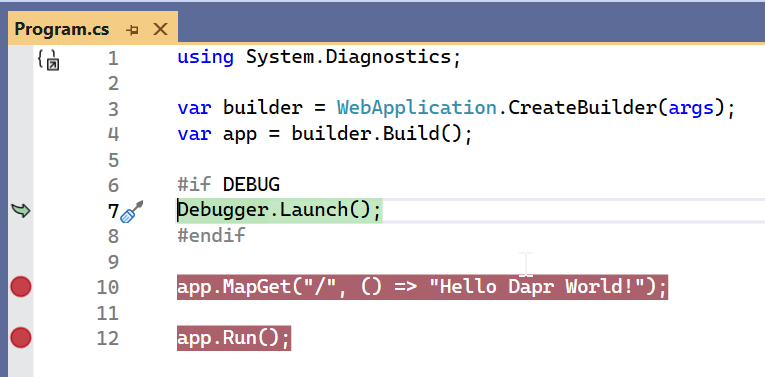
You will hit then also the Debugger.Launch() breakpoint, and you can debug your application.
There are two drawbacks to Visual Studio
- The Choose Just-ln-Time Debugger dialog will open every time, and you must select the project each time.
- A shell window will open on your desktop.
Alternative solution for Rider
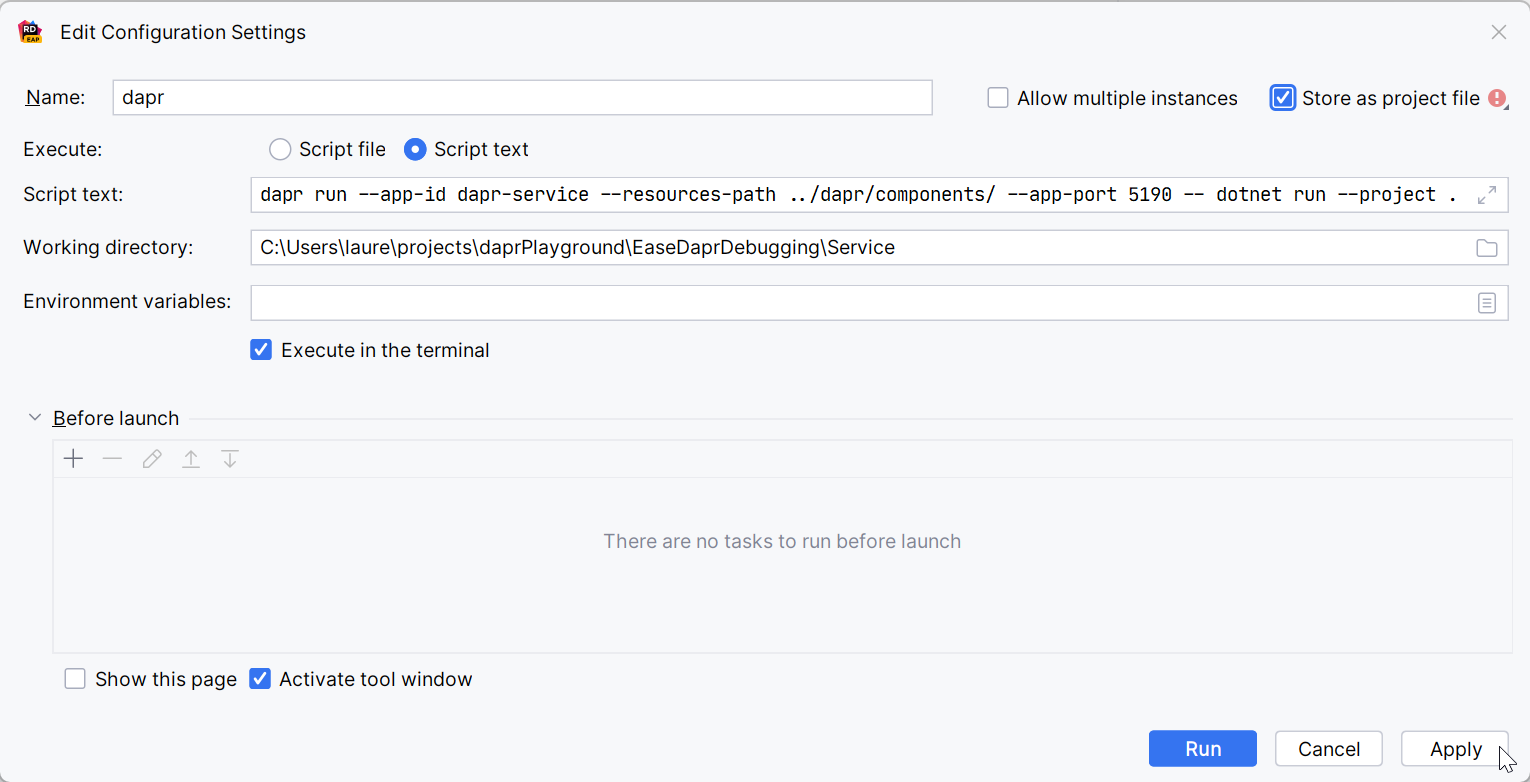
Using Rider, you can create a Shell Script Run/Debug configuration.
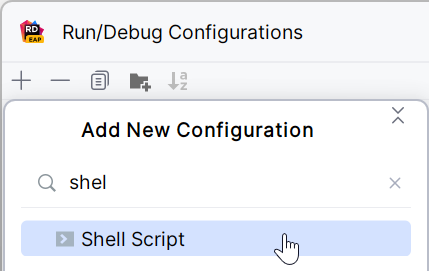
Using Script text specifying the Dapr CLI command to run the application. We set the Working directory to the directory in which the service is located. And we define the Run/Debug Name as dapr. Finally, we tick Store as project file to share this run configuration with other developers.
We can select and start the dapr Run/Debug configuration. The Dapr sidecar will start, and the application will start. Then debugger will be attached to the process, and we can debug our application 😀.
Conclusion
In this post, we have seen how to debug a Dapr application. We have seen that we can use Debugger.Launch() and nest it in a #if DEBUG C# preprocessor directive. We have seen that we can use the launchSettings.json to run our application with Dapr or without Dapr. We have seen how to configure Rider and Visual Studio to debug our application with Dapr.
Code
The code for this post is available on my project daprPlayground / EaseDaprDebugging .
