
Memory leak with WPF resources
I am working for a couple of months now with WPF and MVVM on an a business application using .NET Framework 3.5 SP1. Lately I faced a memory leak. Not the easy kind of memory leak with events handlers which keeps objects and its element tree alive, as explained here.
No it was something else ! I searched in our code for quite some time without finding anything.
My internet research brought me to a blog post from Ramon de Klein, “Memory leak with WPF resources (in rare cases)” which stated :
When does the problem occur?
The problem occurs in the following situation:
- A style is defined in the application’s ResourceDictionary.
- The style uses a control template that uses media effects (i.e. DropShadowEffect).
- The media effect should be referenced using a StaticResource.
We were matching the two first points and I tried the proposed fix:
You can force the effect to be frozen by specifying “PresentationOptions:Freeze=True”, but this is not common behavior.
…
The workaround is simple… Just add the Freeze attribute to all the effects that you don’t plan to modify at runtime.
But that didn’t made it.
I decided then to move the style definition from the application ResourceDictionary to the MainWindowView ResourceDictionary, which was for sure a better place for it. This to avoid the first point.
This worked! And we do not have this memory leak anymore. But as always when you fix one, some other popped up! But that’s another story.
How did I came to find the blog post from Ramon de Klein ?
With a perfect timing I got an offer from Red Gate to test their latest tool still in Early Access Program: ANTS Memory Profiler 5
You might watch a two parts video here (part1) and here (part2) and read about it here. You can even download a version from their forum, check it out.
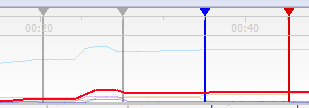 First I used ANTS Memory Profiler 5 Timeline to see that the memory wasn’t released at certain points in which it should. The red line shows the Bytes in all Heaps and should go down after each vertical line (gray, blue and red)
Same result with Process Explorer, Memory usage going up without going down.
So we got on the screen the memory leak. Next step was to identify it.
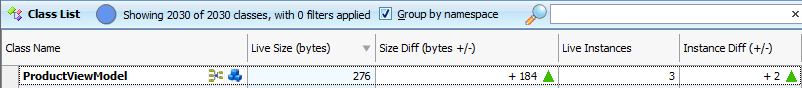
Using Memory Profiler Class List, I browsed to the class that I new should be released, and proved it wasn’t: Live Instances is 3 and Instance Diff is +2. So at that time I knew that this class was maintained by something in memory.
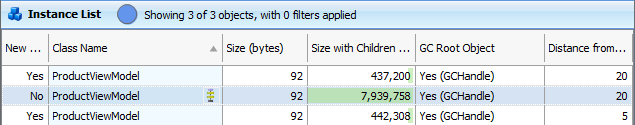
Watching the Memory Profiler Instance list, I could identity the different instances still in Memory and one wasn’t new, so a good candidate to look at:
Finally switching to the Memory Profiler Object Retention Graph, I could navigate up the graph to see that DropShadowEffect was maintaining a reference:
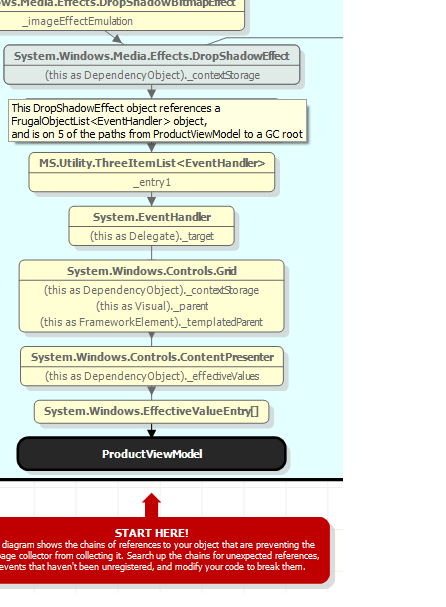
Up to my application RessourceDictionnary, as exaplained in point 1 from Ramon de Klein blog post, as you can see.
All those information gave me the opportunity to find the blog post from Ramon and led me to the solution.
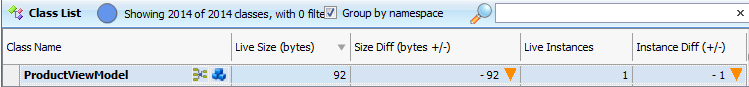
This is the result of the fix I implemented, as you can see I have now only one Live Instance of the ProductViewModel class and an Instance Diff of –1. This shows that the object wasn’t retained in memory and cleaned correctly.
ANTS Memory Profiler 5 and Ramon de Klein “Memory leak with WPF resources (in rare cases)” blog post was of great help to fix this memory leak. Thanks!
Thanks flies also to Stephen Chambers for the support with my questions on ANTS Memory Profiler 5.
Finally I would like to warmly THANKS **Laurent Bugnion **for his kind chats that helped a lot, as always!